Daily Fantasy Sports Lineup Creation
For my final project at Metis, I built a lineup creation tool for daily fantasy sports. The first step when playing fantasy sports is to build a model to project how many fantasy points they will score, and to do that you need historical statistics to train the model on.
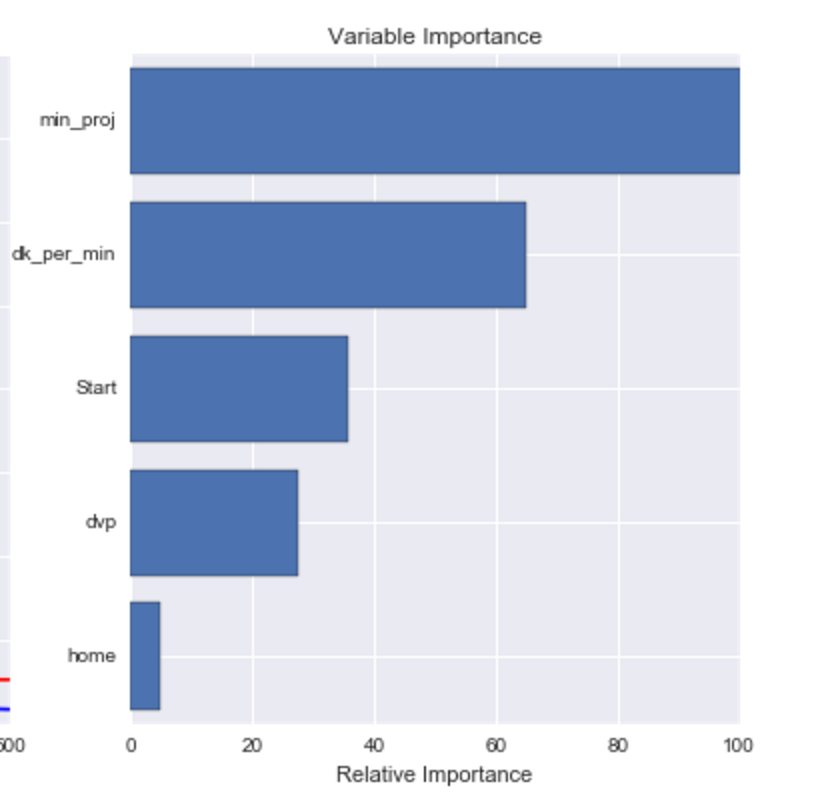
I obtained these stats from RotoGuru, and began building the model. Using advice from quantifan, I trained the model using 5 features - home/away, season long DraftKings points per minute, a 7 day rolling average of minutes played, and DvP. Quantifan shows that the best estimate of a players DraftKings output per minute is his season average long DK per minute, while a rolling 3 game average of minutes played provides a solid benchmark for recent ebbs and flows in minutes on a team (more on DvP below). As it turns out, by far the most important part of the model is minutes, as shown here in a graph of feature importance:
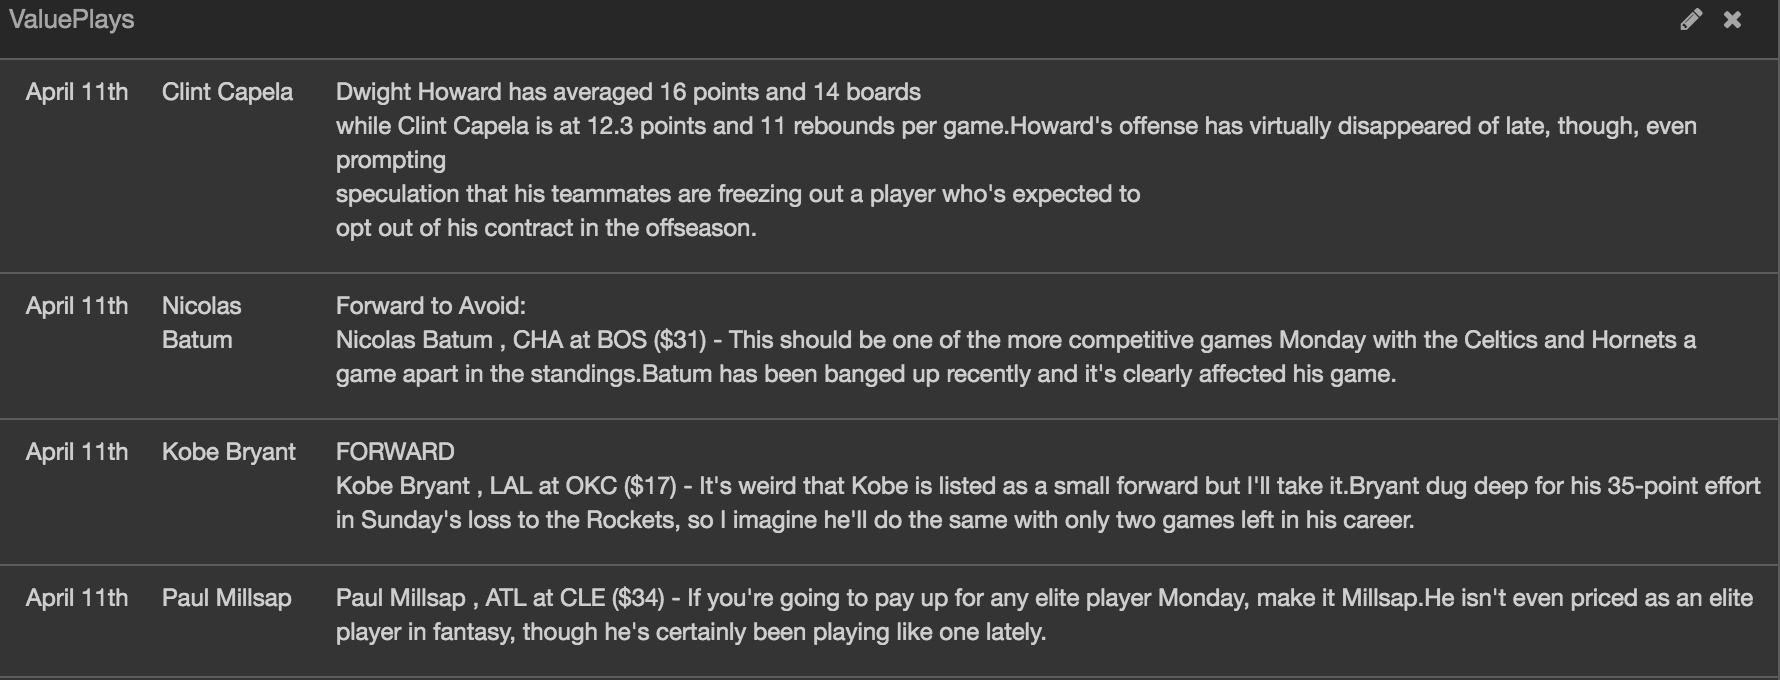
Since the bulk of our time should be spent projecting minutes, and minutes are influenced by the day to day news and injury cycle of the nba, it is critical to be on top of the latest news and injury information. To that end, DFSharp first pulls in daily articles, blogs, and reports from DFS writers, parses it for each player mentioned, and displays them all in a chronological format like this:
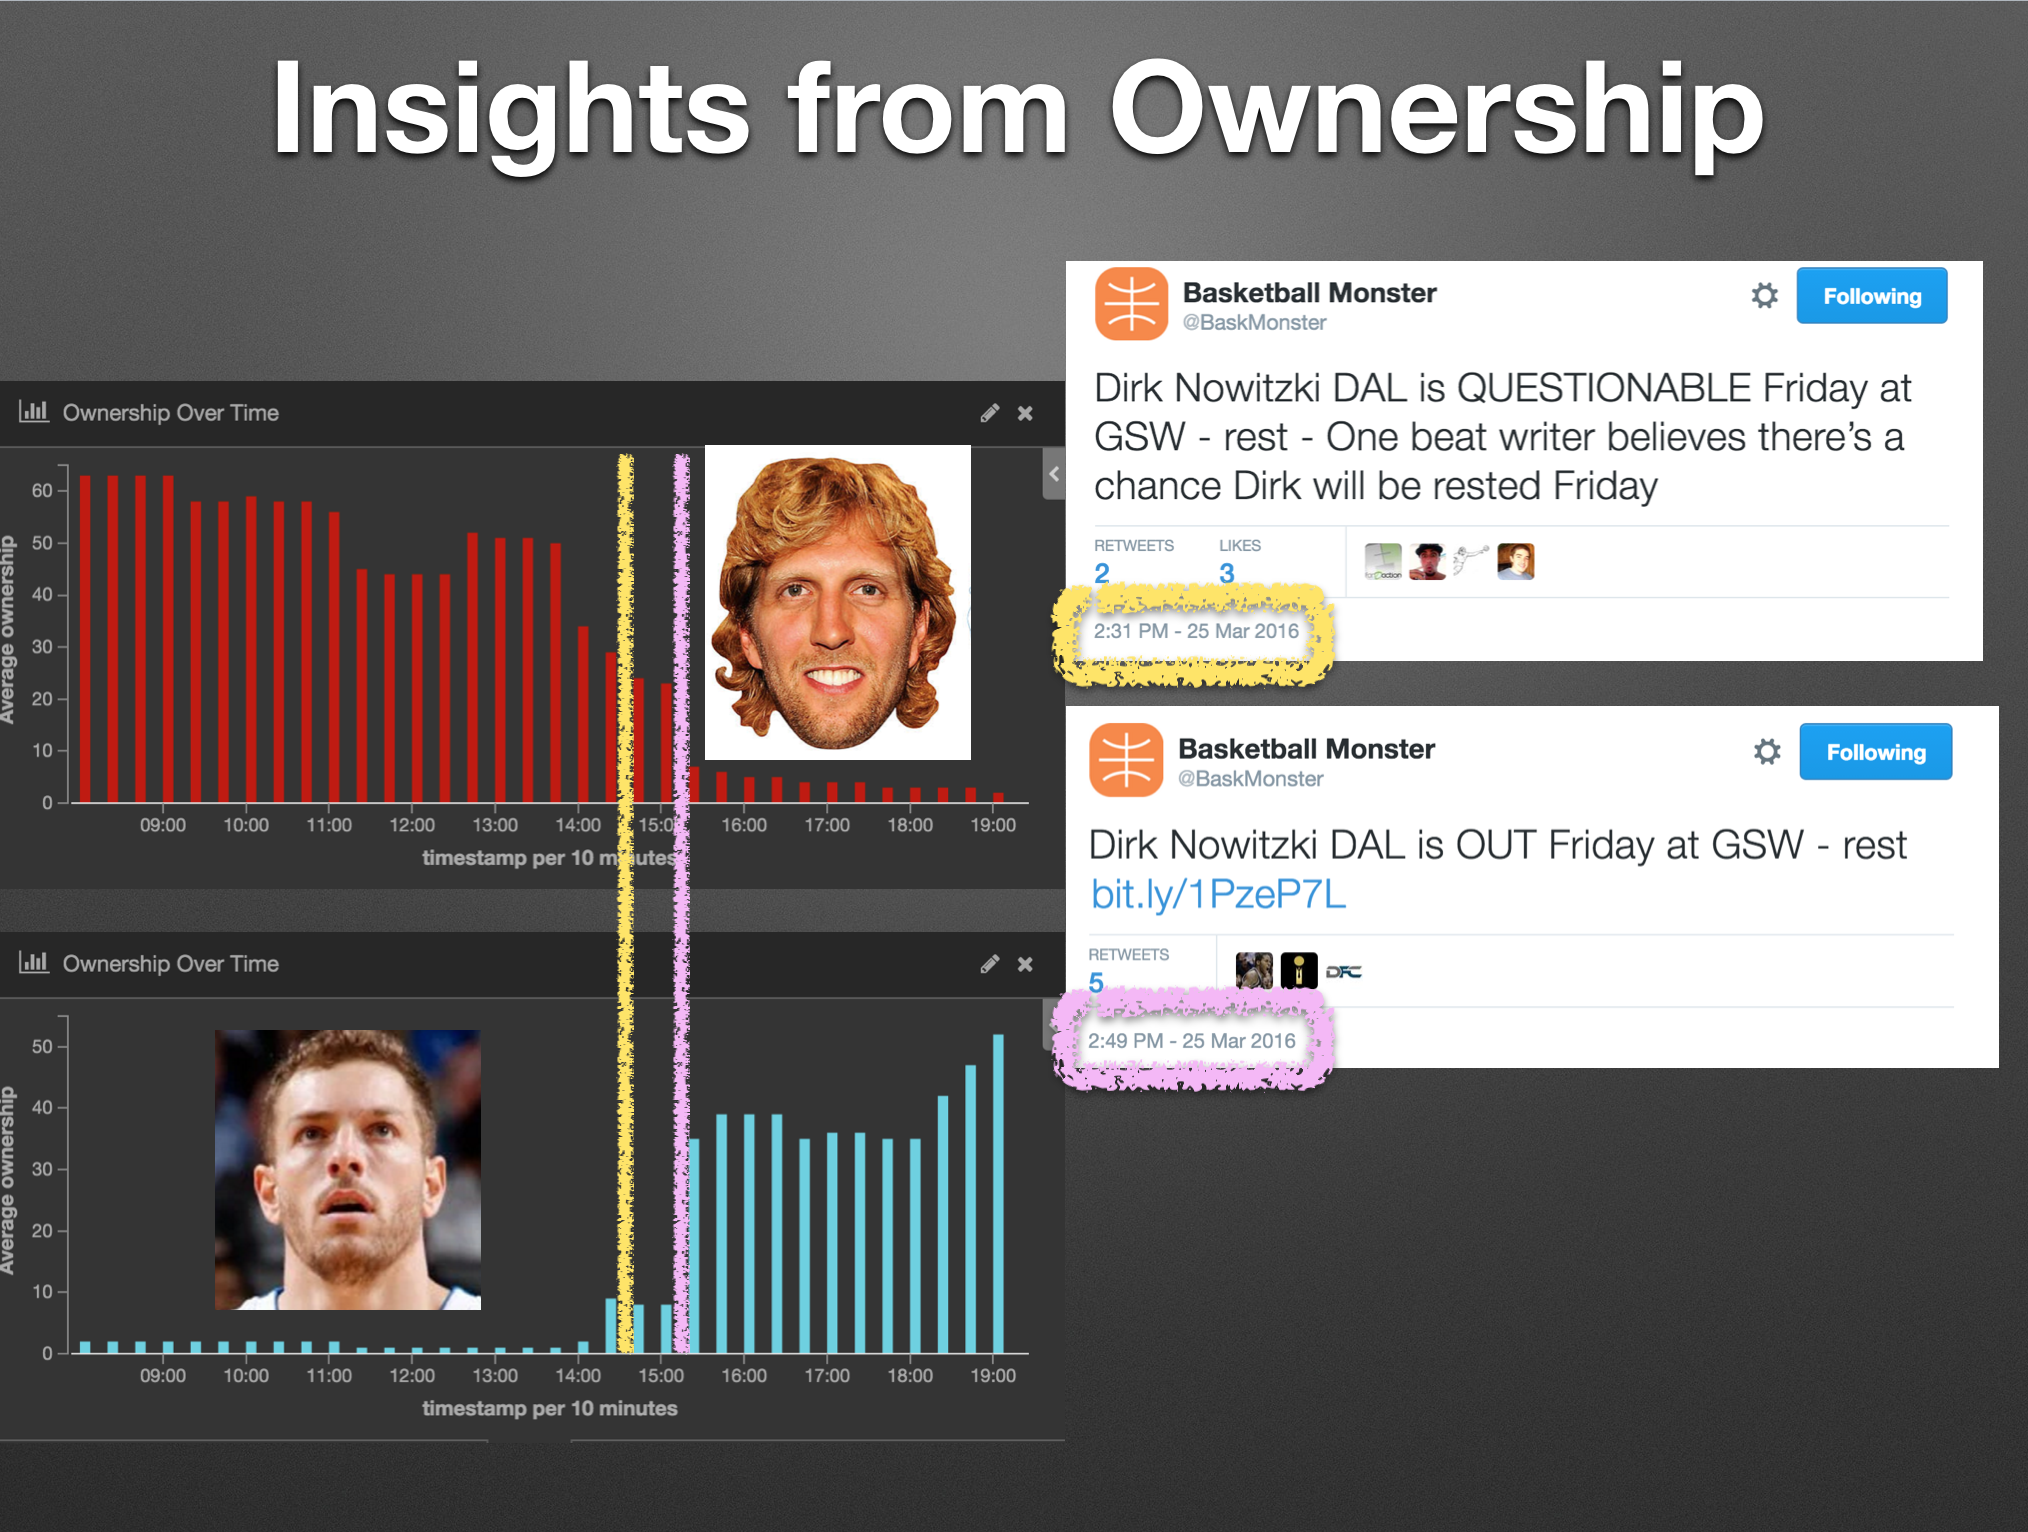
 Additionally, DFSharp monitors twitter accounts like BaskMonster for breaking injury news. When we receive a tweet that a player is Questionable, his minutes projections are adjusted down to 90% of what they were. When we find out a player is Out, his minutes are adjusted to 0 and the projections are re-run. The tricky part is figuring out how to allocate those minutes to his teammates. Many other fantasy projection websites will manually adjust minutes projections to news because this problem is very difficult to solve for an algorithm.
To model matchups, most sites use a stat called DvP- which is a ranking of how many fantasy points each team gives up to each position. This is a solid approach to modeling matchups, in that it will capture things like the Lakers being unable to defend point guards, but it will be inaccurate when players aren't listed at the positions they actually play. For example Tim Duncan, perenially listed as a power forward, actually usually plays center. In order to account for this, I used the approach taken in this Nylon Calculus article. That author uses the concept that a players offensive position is defined by which position spends the most time guarding them, determined using the SportVU closest defender to shot data. So even though Tim Duncan is listed as a 4, since he is typically guarded by 5s, he will show up as a 5 using this method. Using this, the DvP stat in my model is actually how many points each team gives up against the players at each SportVU determined position.
Another key factor when building lineups involves ownership- the percentage of people who also have the same player in their lineup. This is important for two reasons, the first is that high ownership players tend to be strong plays, as there is usually a good reason the field has all flocked to a certain player. Therefore having all high ownership players can be a useful strategy for cash games or double up contests. On the other hand, for GPPs or large field tournaments, it is beneficial or even necessary to have a few very low ownership players on a roster, to minimize the chance of tying with another contestant, and to be able to separate your lineup from the pack.
To help with this, DFSharp pulls in live ownership data from the OwnThePlay API. Minutes before lineup lock, the OwnThePlay percentages have an 80-90% correlation with actual draftkings ownership levels, so they are a very useful approximation for who the high owned players will be. After pulling in the ownership stats, the model breaks the players into quintiles based on ownership and assigns them an "ownership rating" of 1-5. Then, when the ownership number is changed on the optimizer, those ratings are either added to or subtracted from a players projections, which allows the optimizer to create lineups with maximum ownership (when set at 5), with minimum ownership (when set at -5), or with no ownership factor, when set at 0.
Ownership is also helpful to see which players are anticipated to get minutes following an injury. Here is an example of this in action, where the graphs are of live ownership data over time on March 25th. We can see the public reacting to Dirk being rested by increasing the ownership of his teammate David Lee drastically:
For visualizing the data, I use Elasticsearch and Kibana. They are two components of the ELK stack, and I followed the tutorial hereto get up and running. Once elasticsearch and kibana are running, we can use python to insert records into elasticsearch, and then use kibana to easily create dynamic charts such as this one- showing the projected DraftKings points, Minutes, and current Ownership of players, sorted by "Value" (Projected Points / Salary).
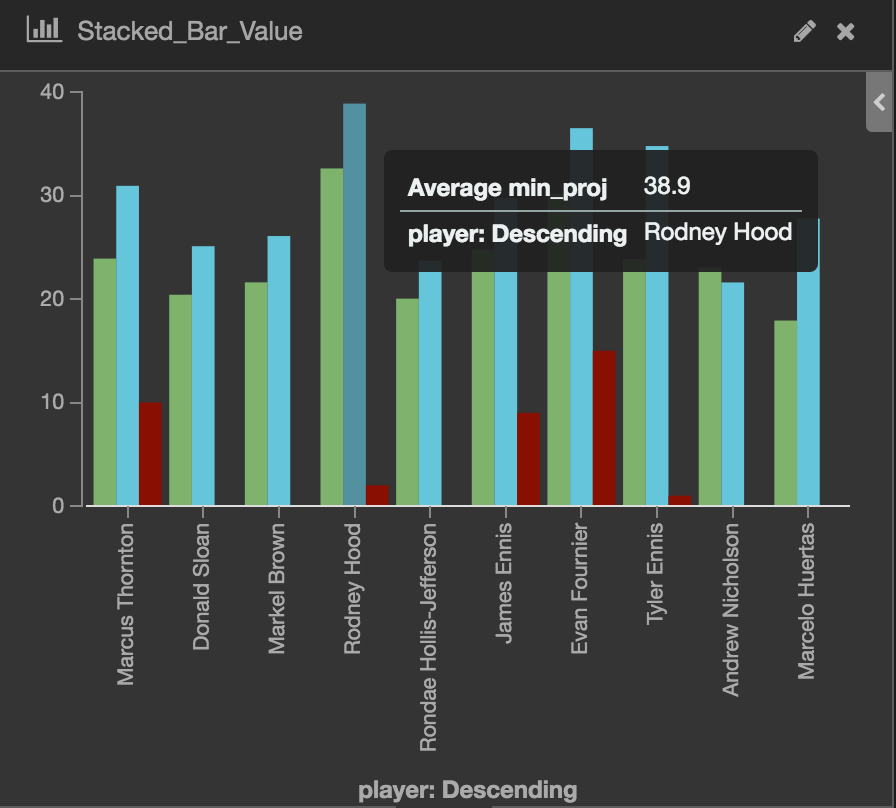 The other nice thing is the user can click on a player in a bar chart, and everything on the page will filter to that player. Additionally, one can use the search bar at the top to search for a specific player, or team, or set up filters to show all players from a certain position, certain team, or certain projected value.
Finally, the lineup optimizer and an embedded kibana dashboard are combined into a flask app. The flask site allows the user to make a lineup, and inserts the lineup into elasticsearch for instant visualization, as shown here:
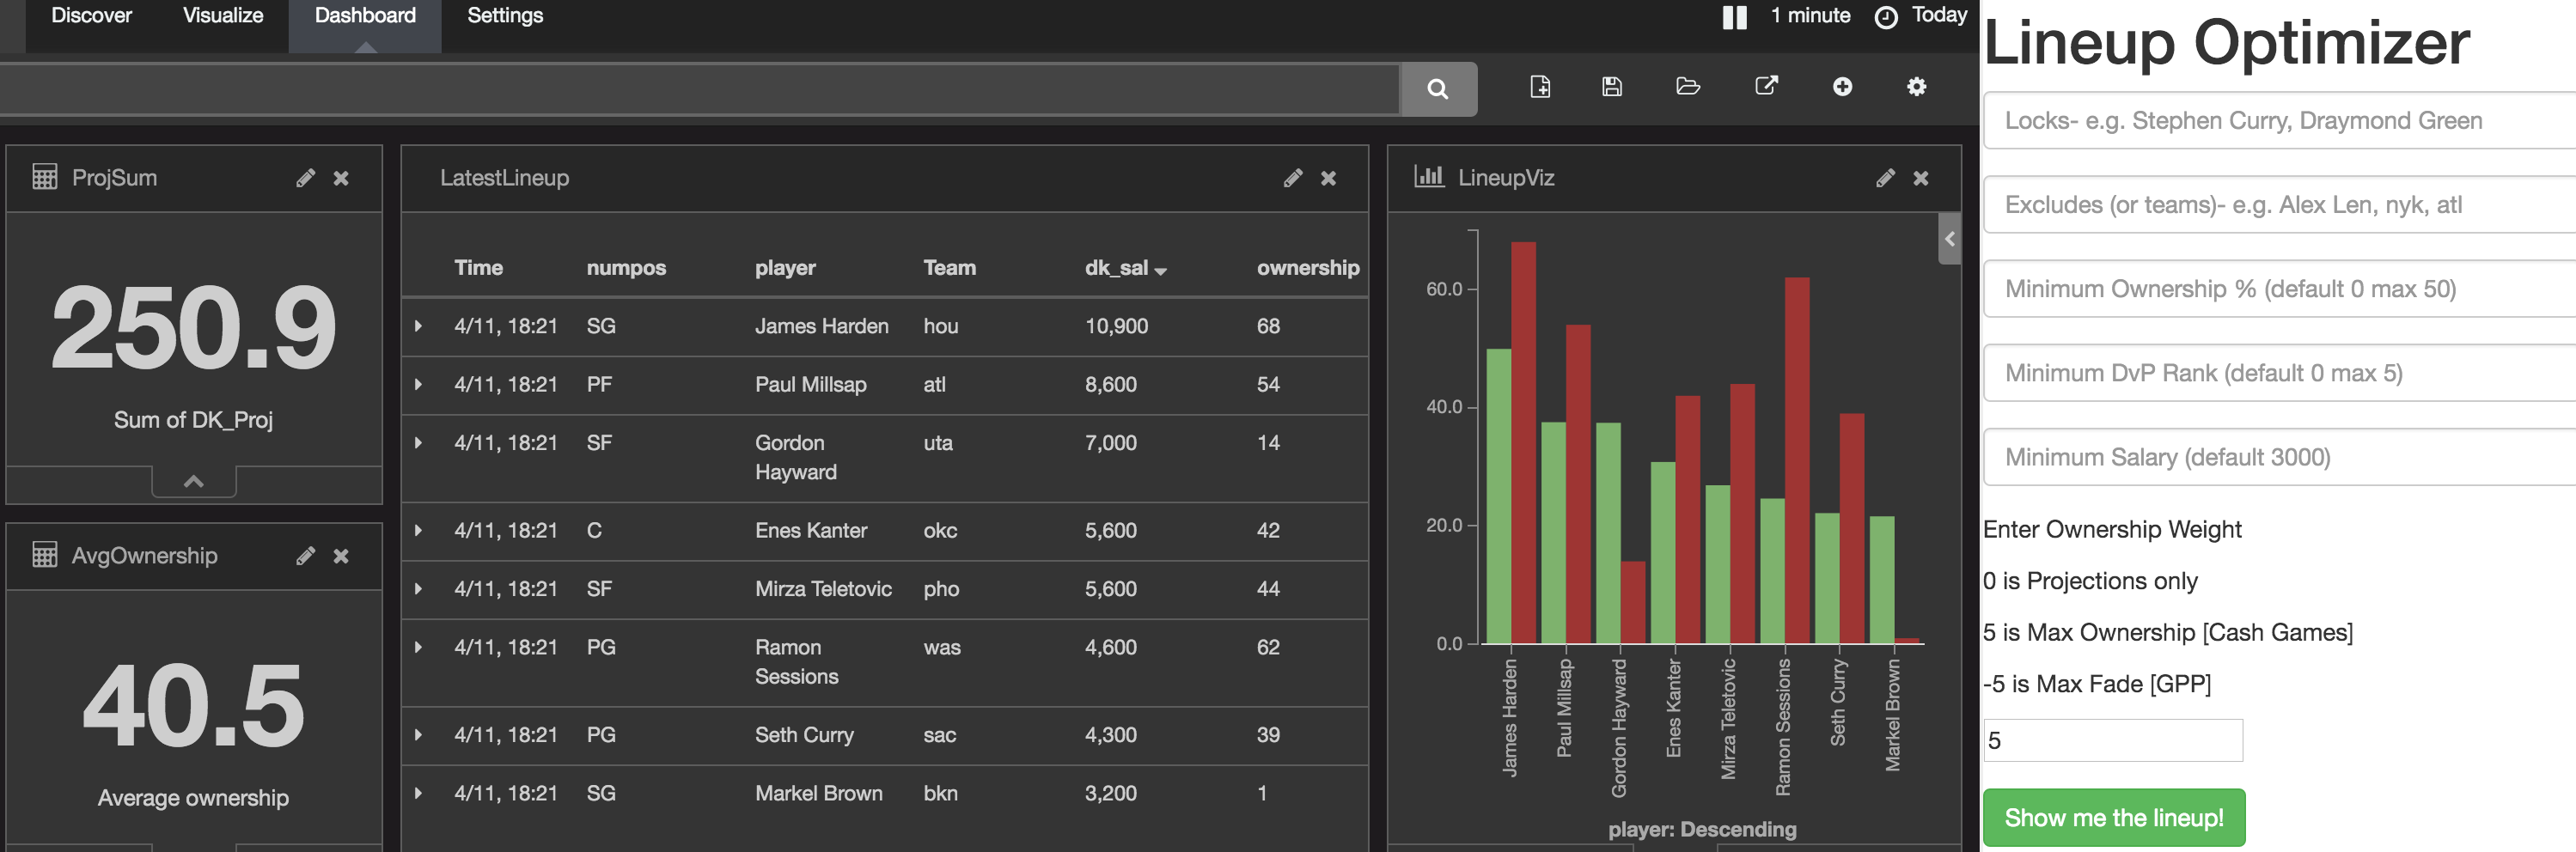 Feel free to play around with it and make some lineups - my personal recomendation is to use a 3 value on ownership, a minimum ownership of 10, and to optimize 5-10 minutes before the standard 7:00 tip off. As always, keep an eye out for late breaking news and how that impacts the value of players.
The site can be found at: DFSharp.com