
The Tin Man's Heart
Our latest project involved creating a predictive classification model from a real life dataset. Our team used a dataset relating to heart disease from the excellent UCI Machine Learning Database.
The dataset is comprised of patient information from medical institutes in 4 different locations- Cleveland (Ohio), Long Beach (California), Budapest (Hungary), and Zurich (Switzerland).
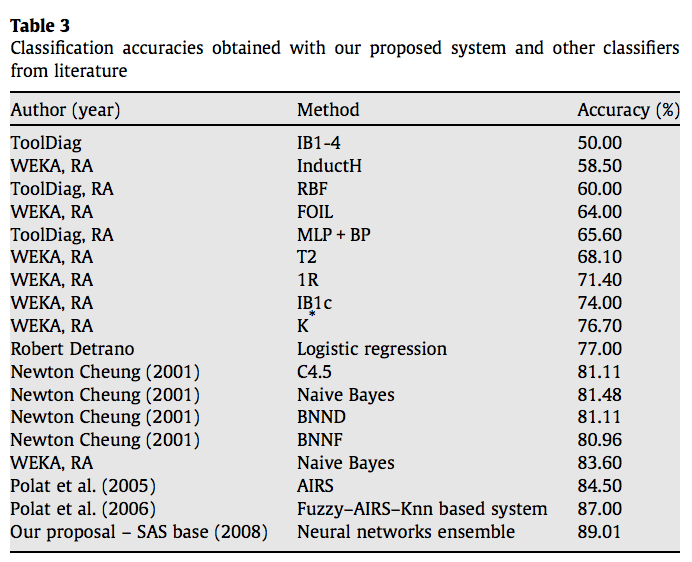
Many machine learning studies have been done using this data to predict the presence or absence of heart disease, and a sample of these studies are below:
My goal was to create a model that used only features that could feasibly be known by a patient before they stepped foot in a hospital, to assess their risk factor for heart disease, and retain an accuracy score on par with the previous studies. After paring down the 50 features to about 10 or so that could conceivably be known to anyone, I then settled on 8 features that had the most impact on model performance. I was trying to strike a balance between having a small number of features to make the model easy to use, and having enough features to have a reliable accuracy.
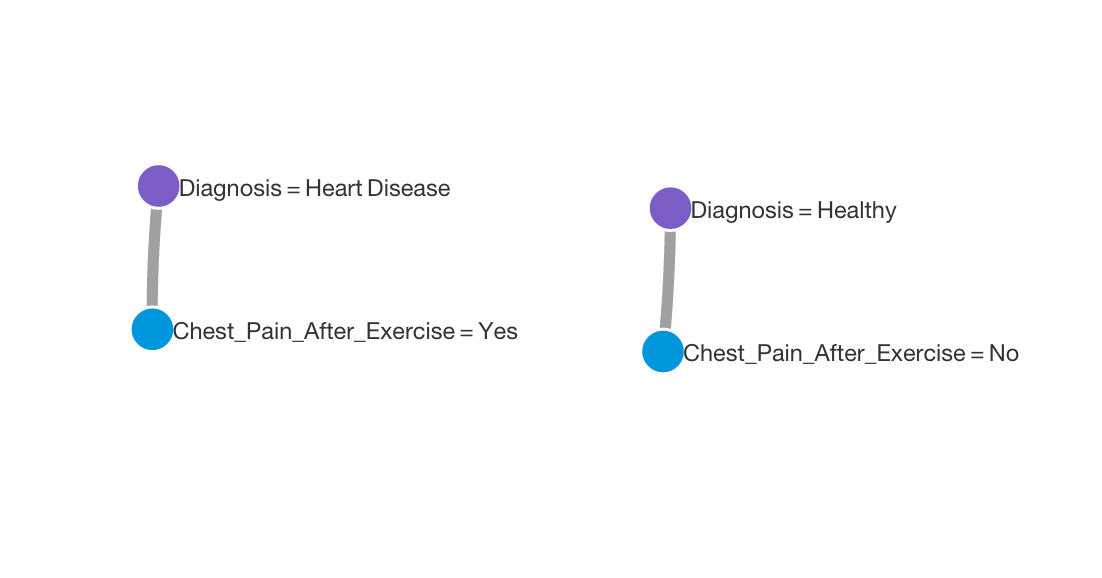
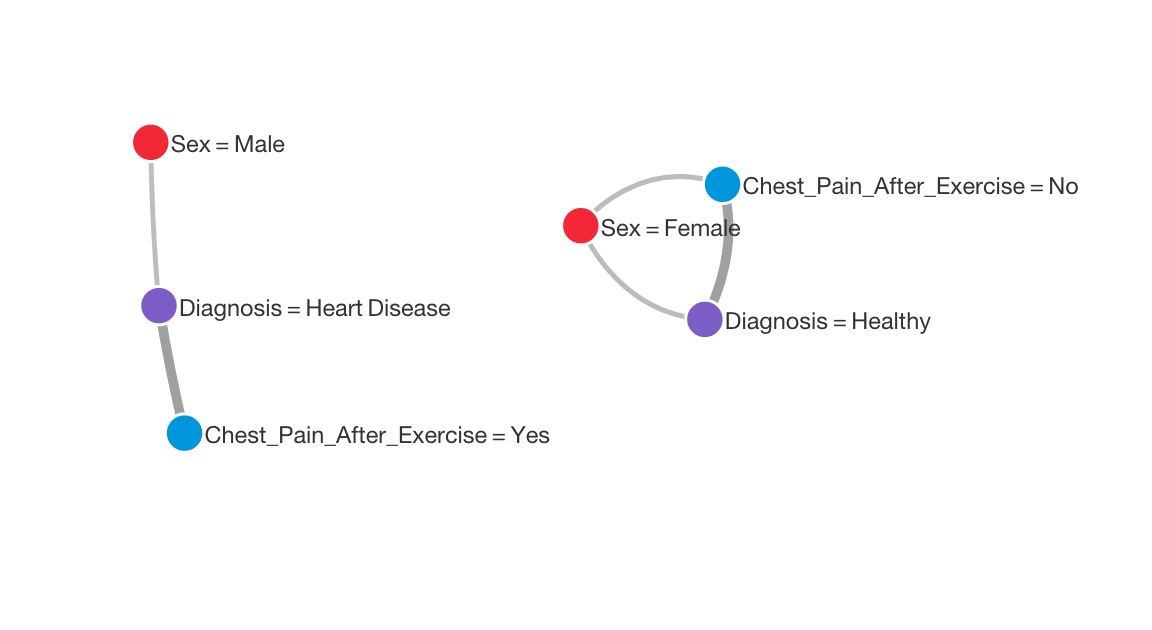
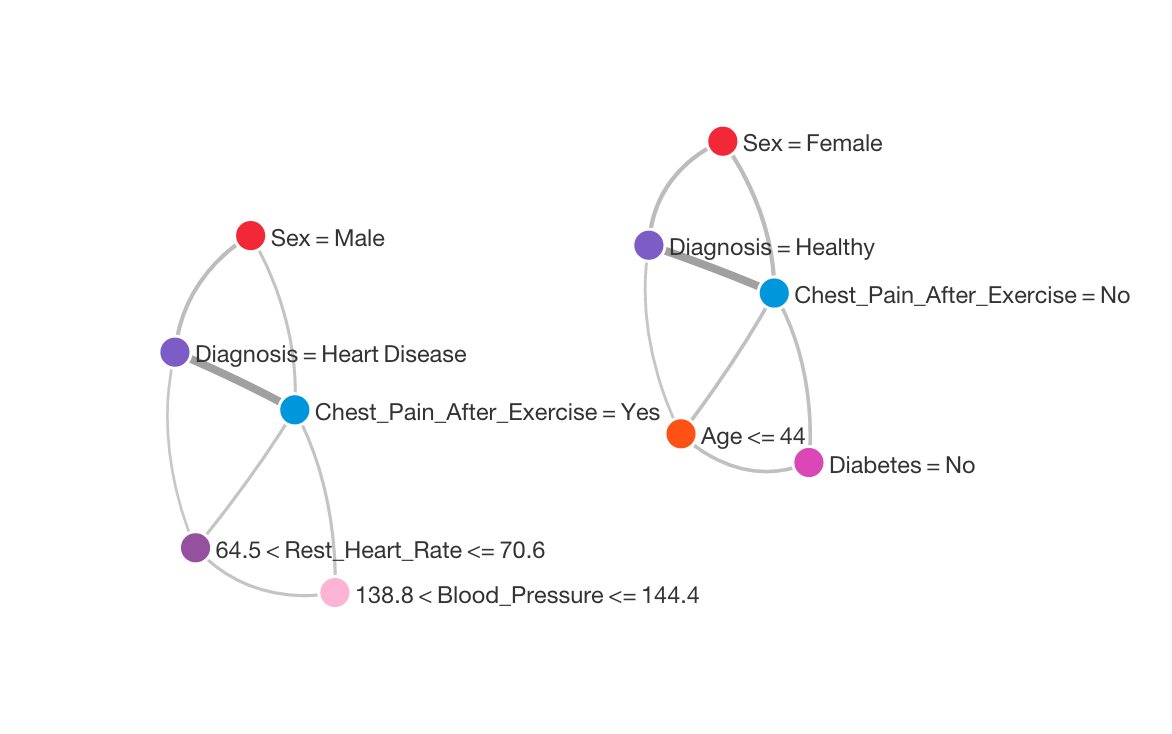
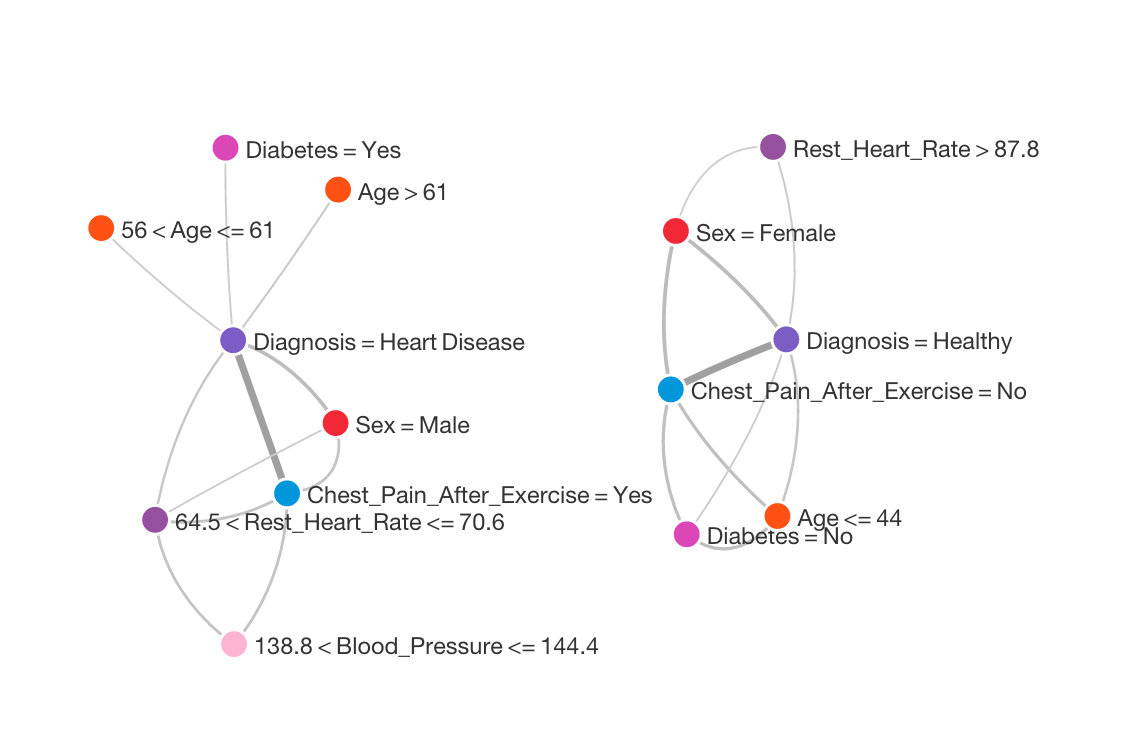
I used BigML to create a network graph illustrating the main relationships in the data. These are shown below.
Next, I used BigML to create a decision tree. Here is an aggressively pruned tree that only uses 4 features, and has an accuracy of 70%:
And here is another tree, using all of the features, with an improved accuracy score, but a similar overall structure:
The visualization is nice, but the accuracy wasn't as good as the models built in SKLearn
BigML-
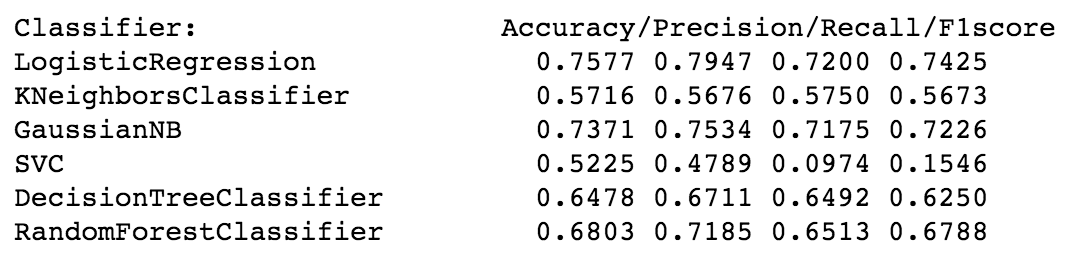
 Scores for a selection of SKLearn models-
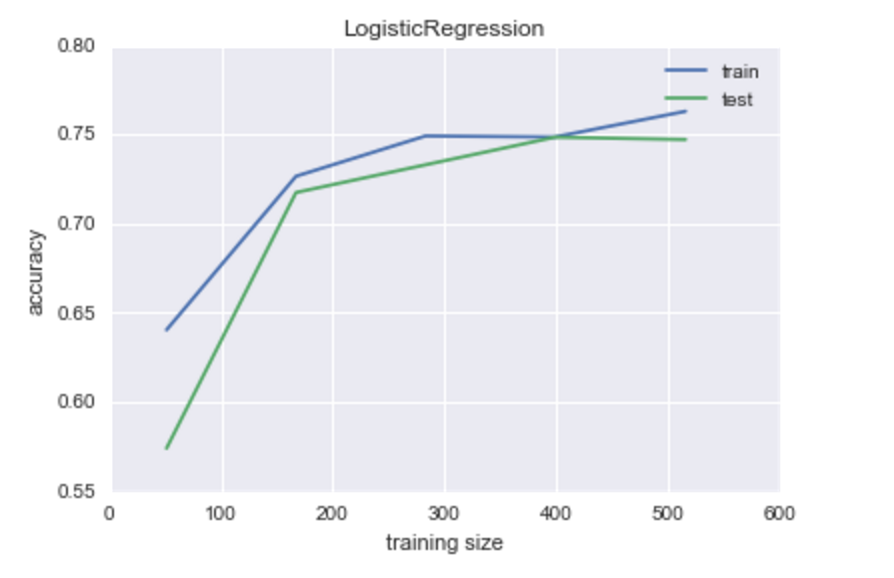
 One of the best performing models was logistic regression, and due to the nature of its construction, it has the added advantage of giving interpretable probabilities to each of its classifications. This was very important to me, as simply telling someone whetehr or not they have heart disease is not as important as assigning a percentage-based risk assessment. Here is the learning curve for the logistic regression model:
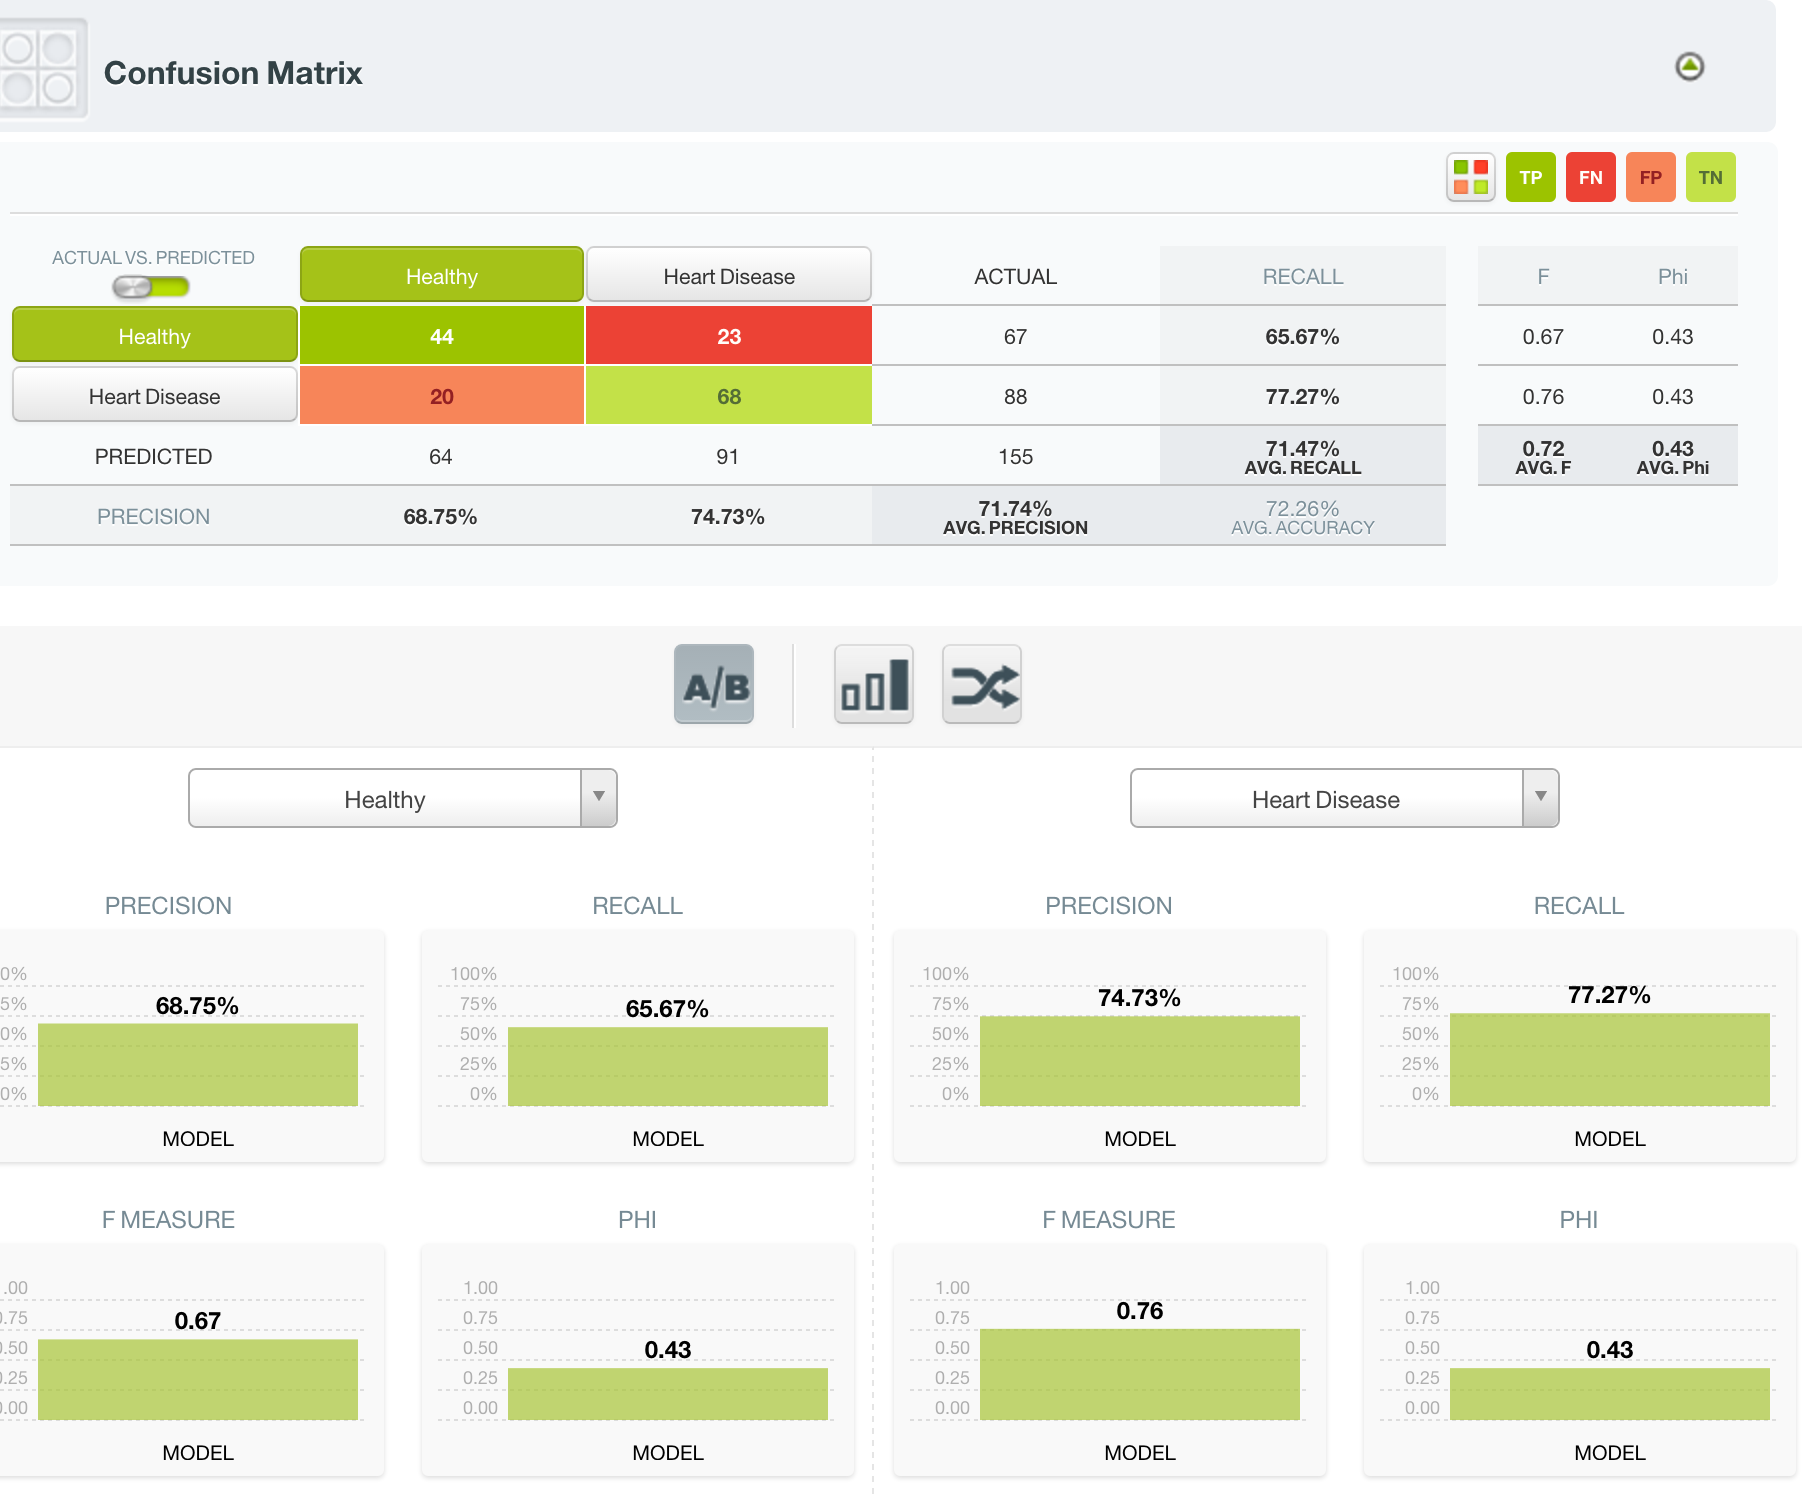
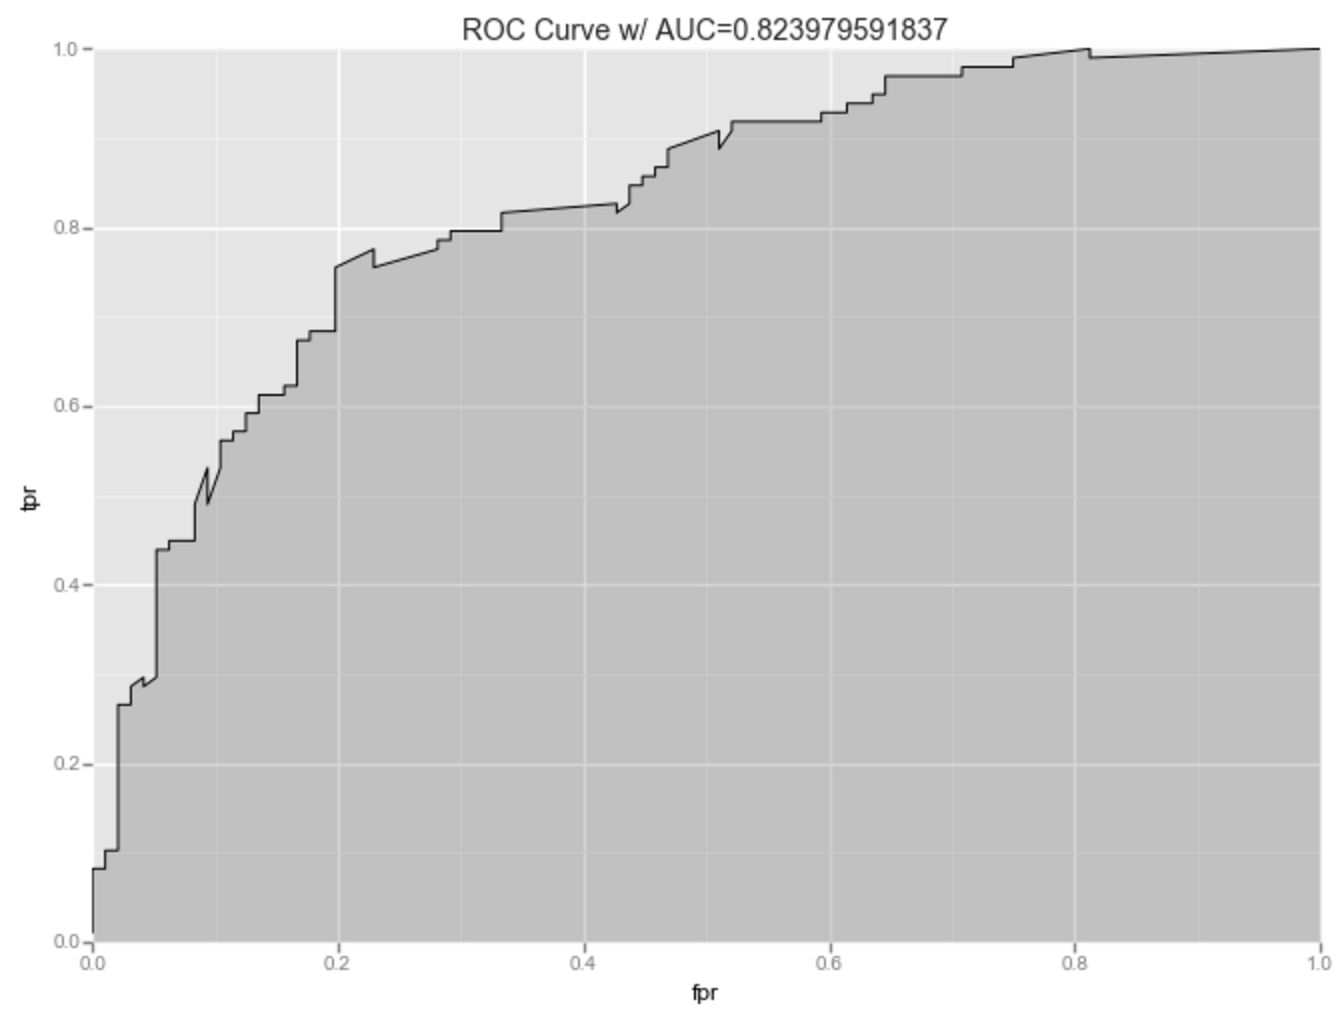
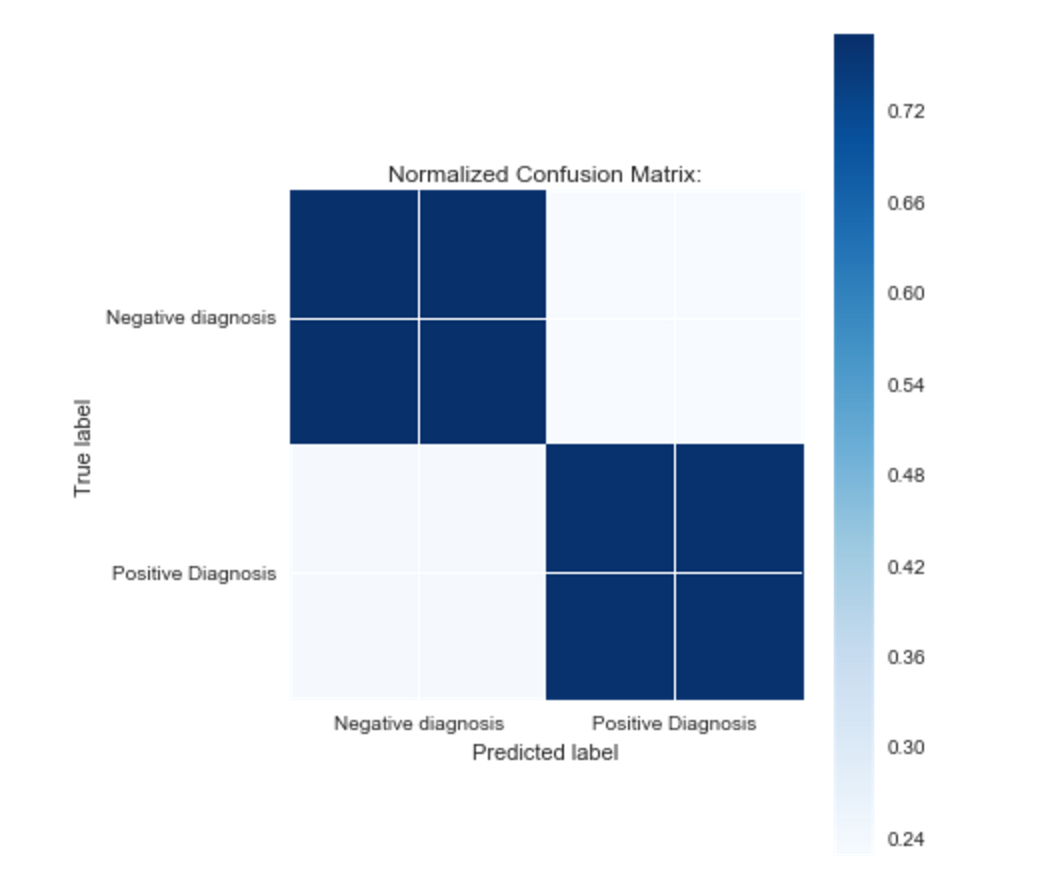
 As the ROC Curve, and confusion matrix below demonstrate, the model does a decent job predicting the presence or absence of heart disease.
Since the model only uses features that anyone could estimate, a natural extension of this project would be to create a live prediction model. This model is currently hosted live on heroku here: Heart Disease Predictor